Iryna Kostiuk
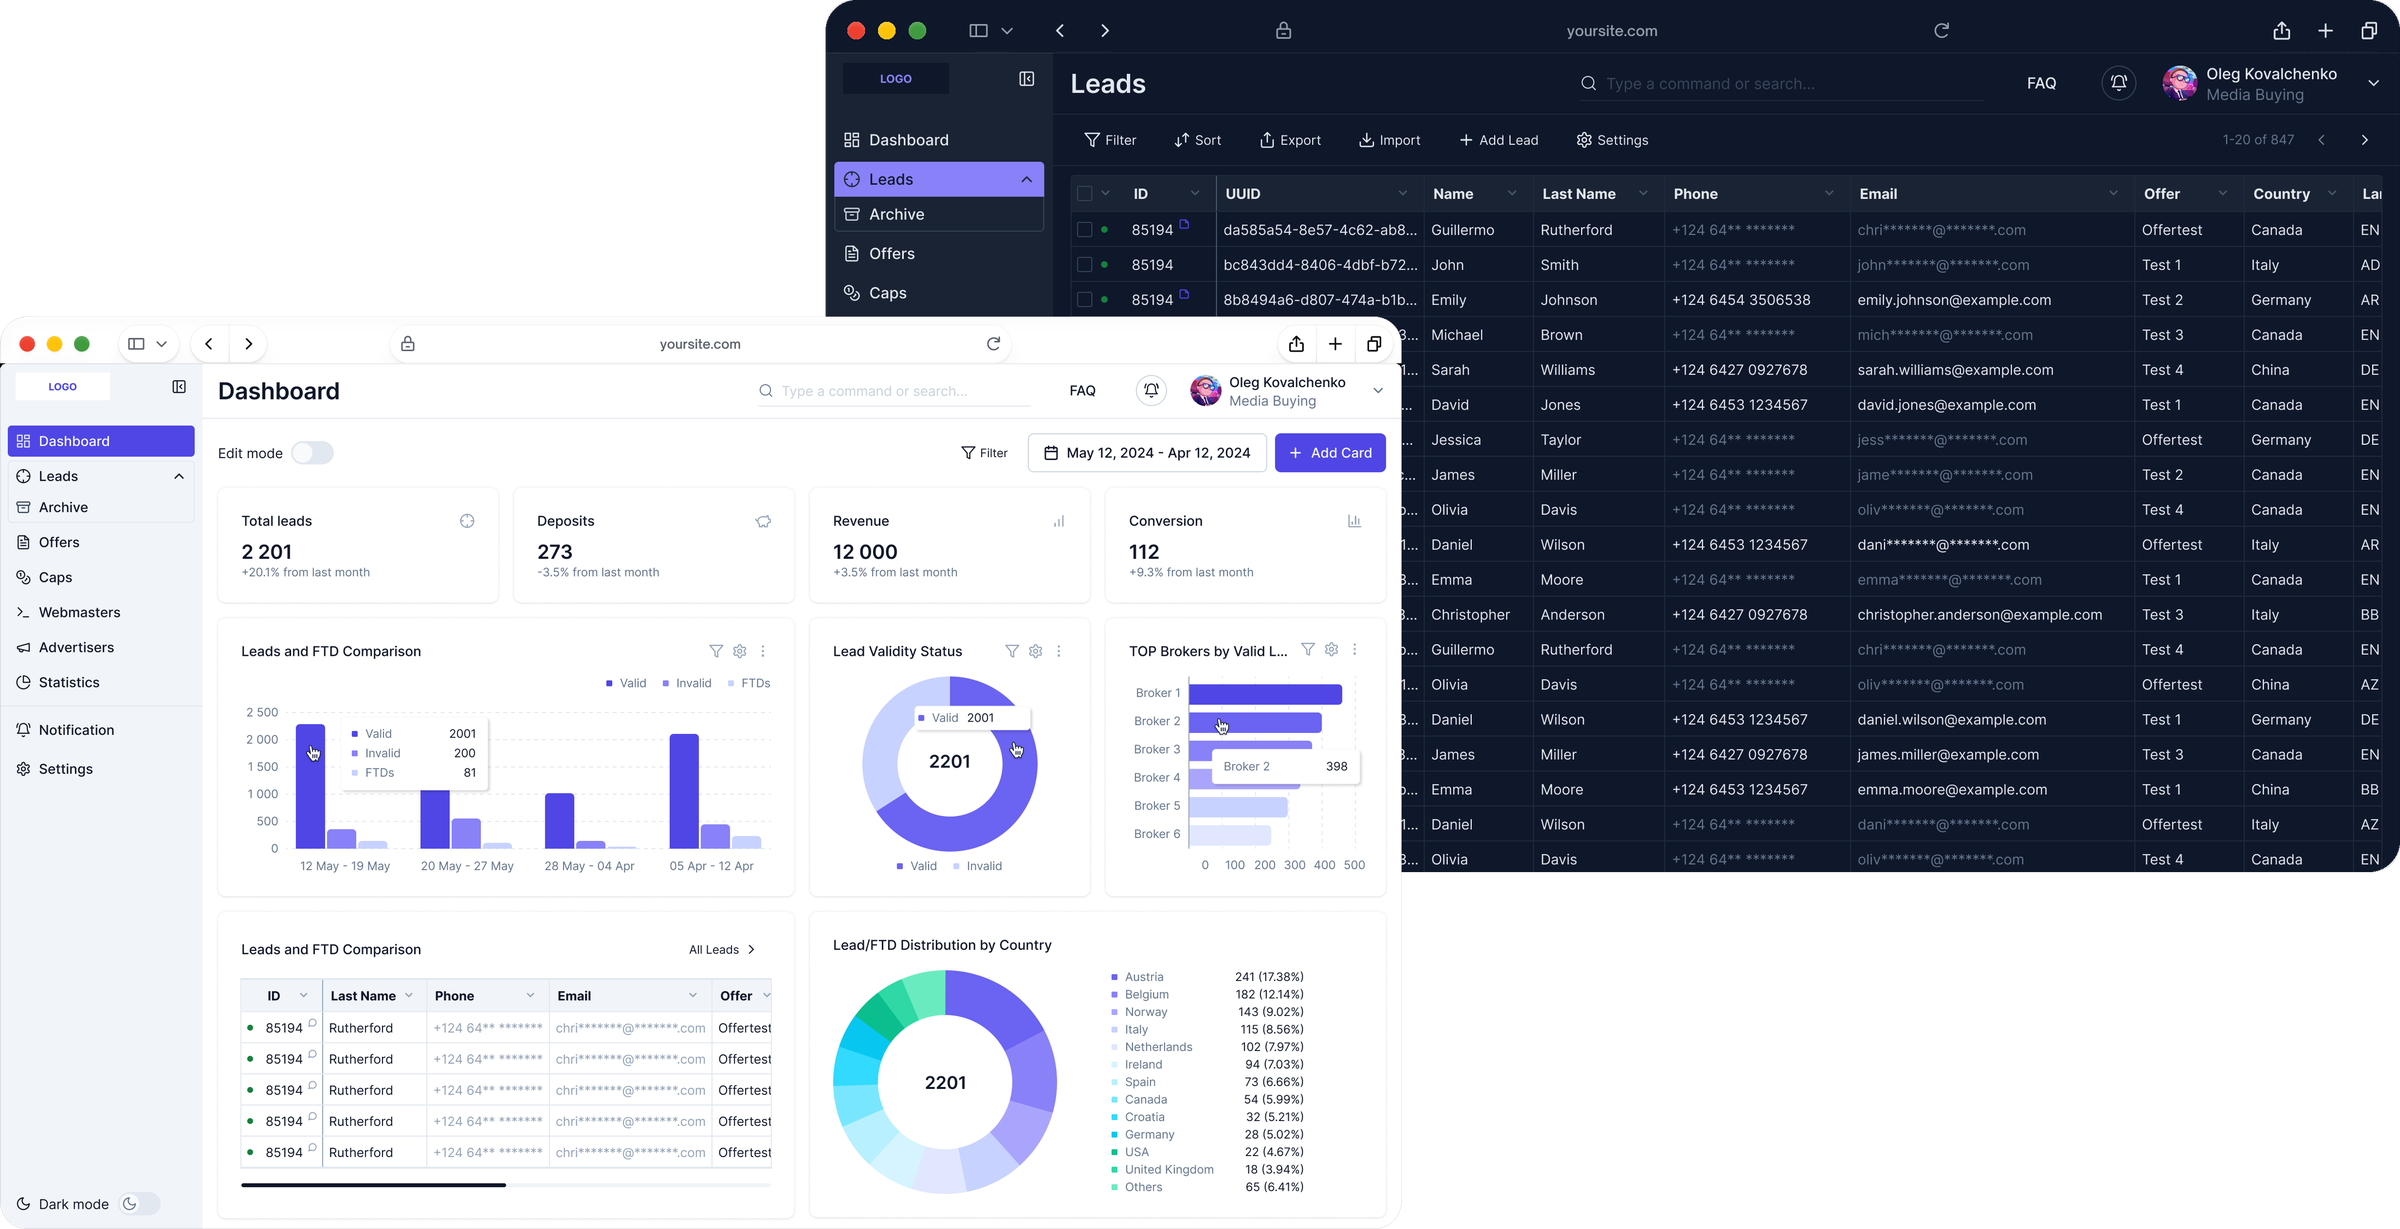
Dashboard in the light theme in front of the leads table in the dark theme
One CRM for traffic, leads and analytics, in light and dark.
Challenge

Three systems for one job, each with its own logic.

Every user type worked in its own system, so workflows weren’t connected end to end.The UI changed from module to module, and unstable performance eroded trust in the numbers.3 systems had to become 1 CRM with one design language, and the logic rebuilt from the first entry point — in a product with 0 dashboards.
Process

Throughout, I worked closely with the client, the backend and frontend developers, the PM and QA, so every idea was checked against technical limits before it reached the screen.

1

Research: what the business needs, and how others solve it

I started with interviews: the goals of the merge, the technical limits, and how we would know it worked. Then I looked at direct and indirect competitors — how they structure a CRM, build analytics dashboards and handle traffic.

Key findingsWorkflows weren’t connected end to endUI patterns changed from module to moduleNo dashboards at all
2

Foundation: one workflow, a view for each user type, two themes

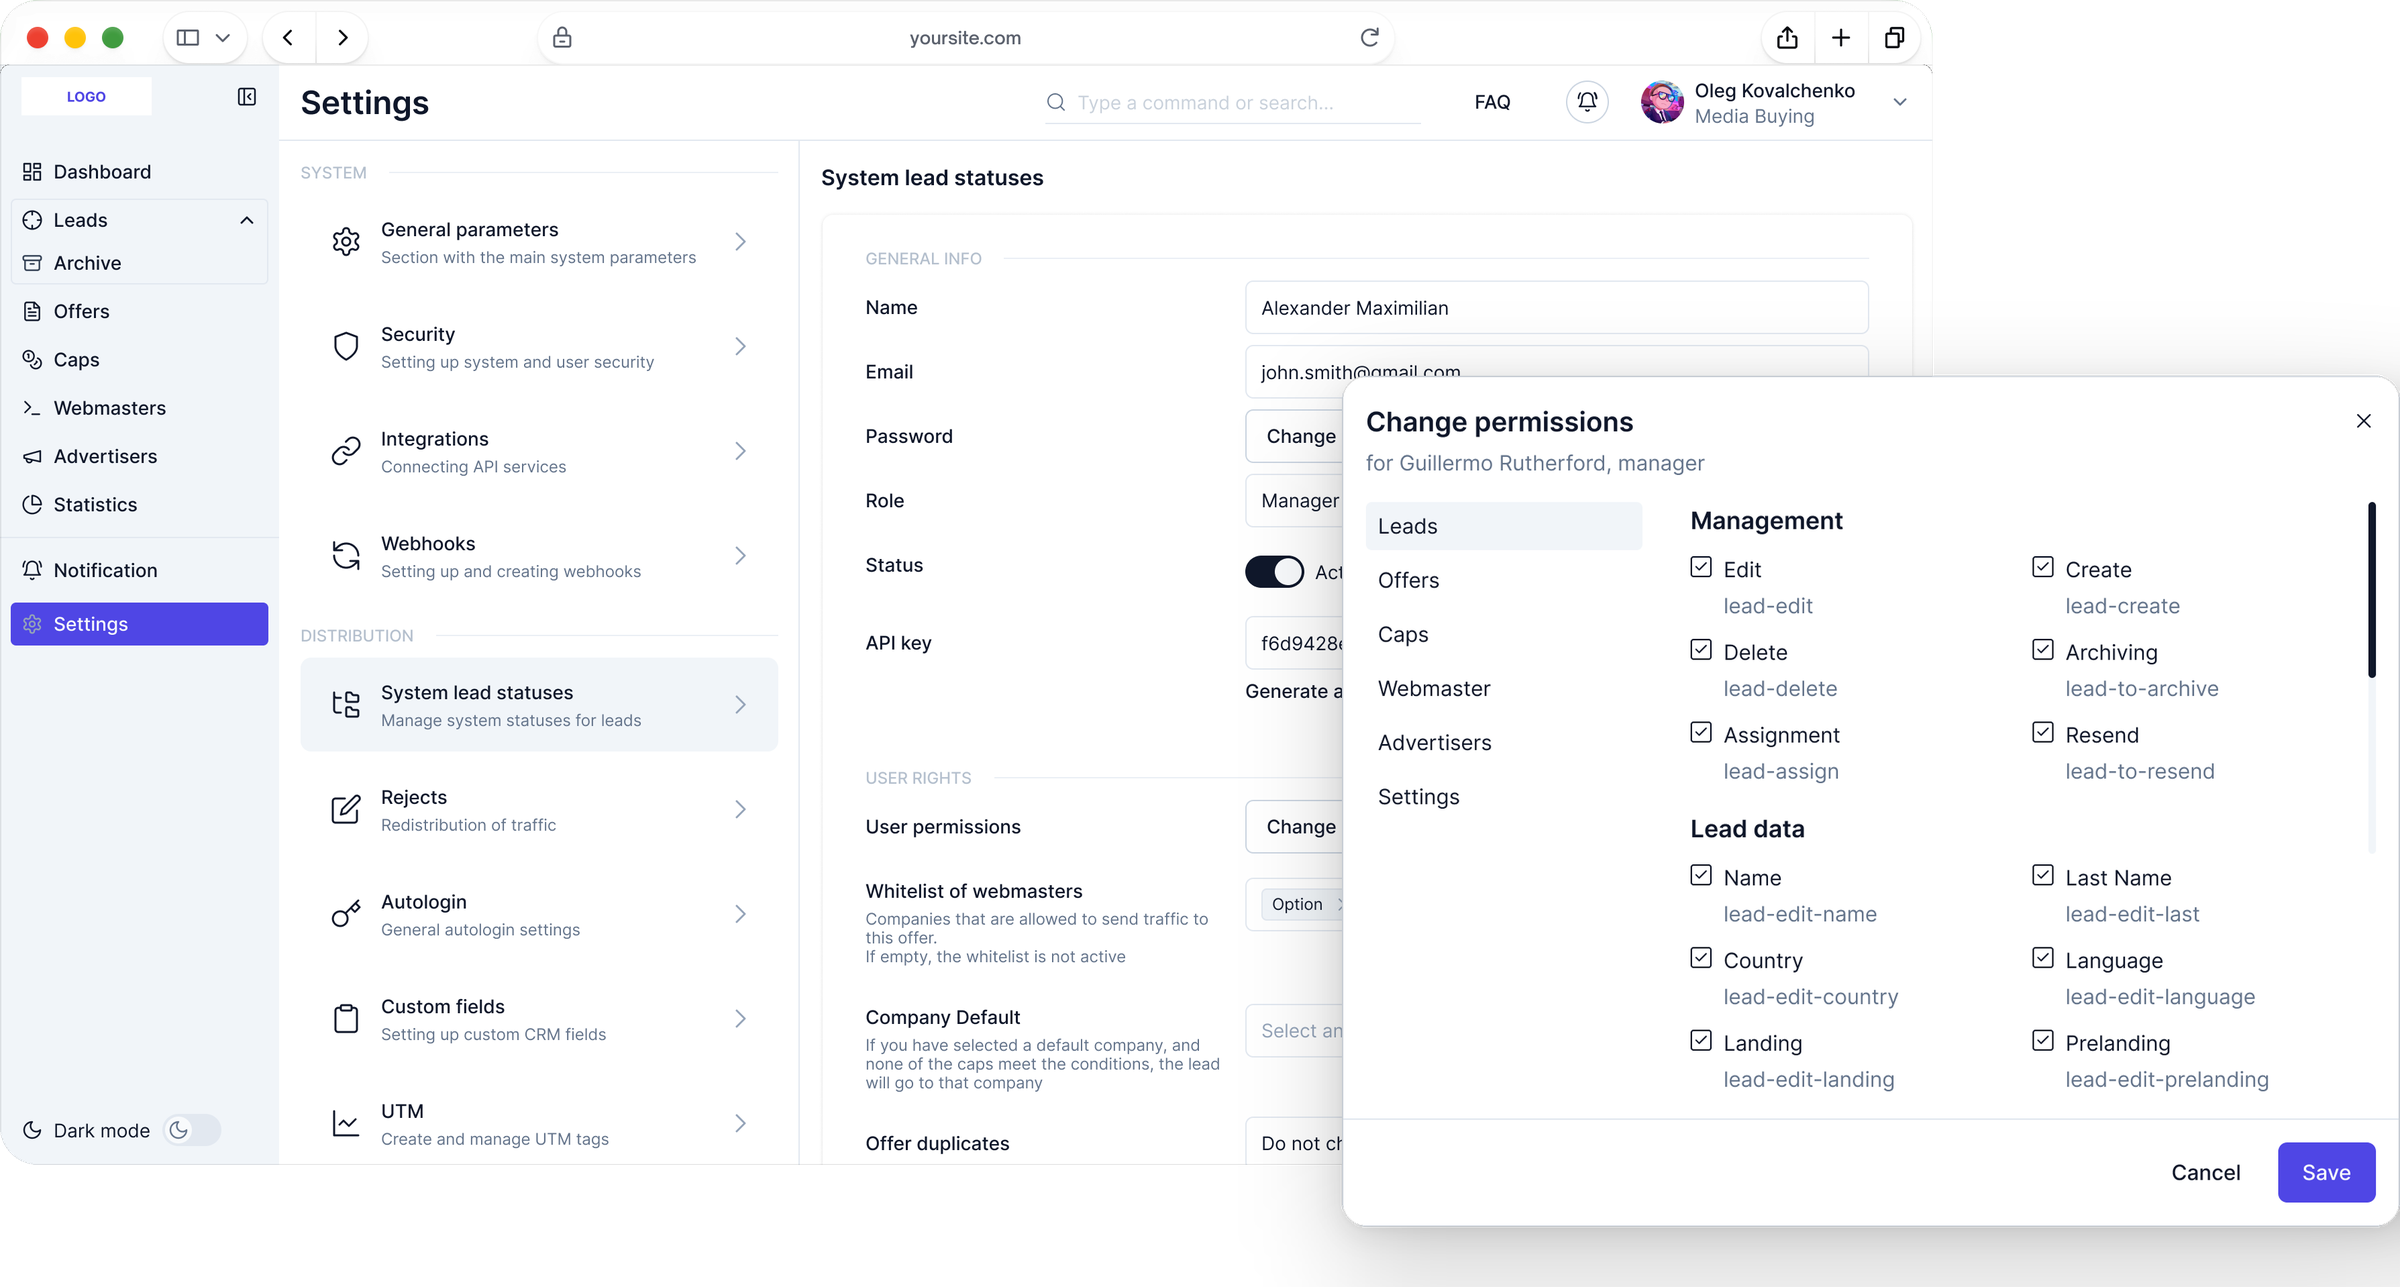
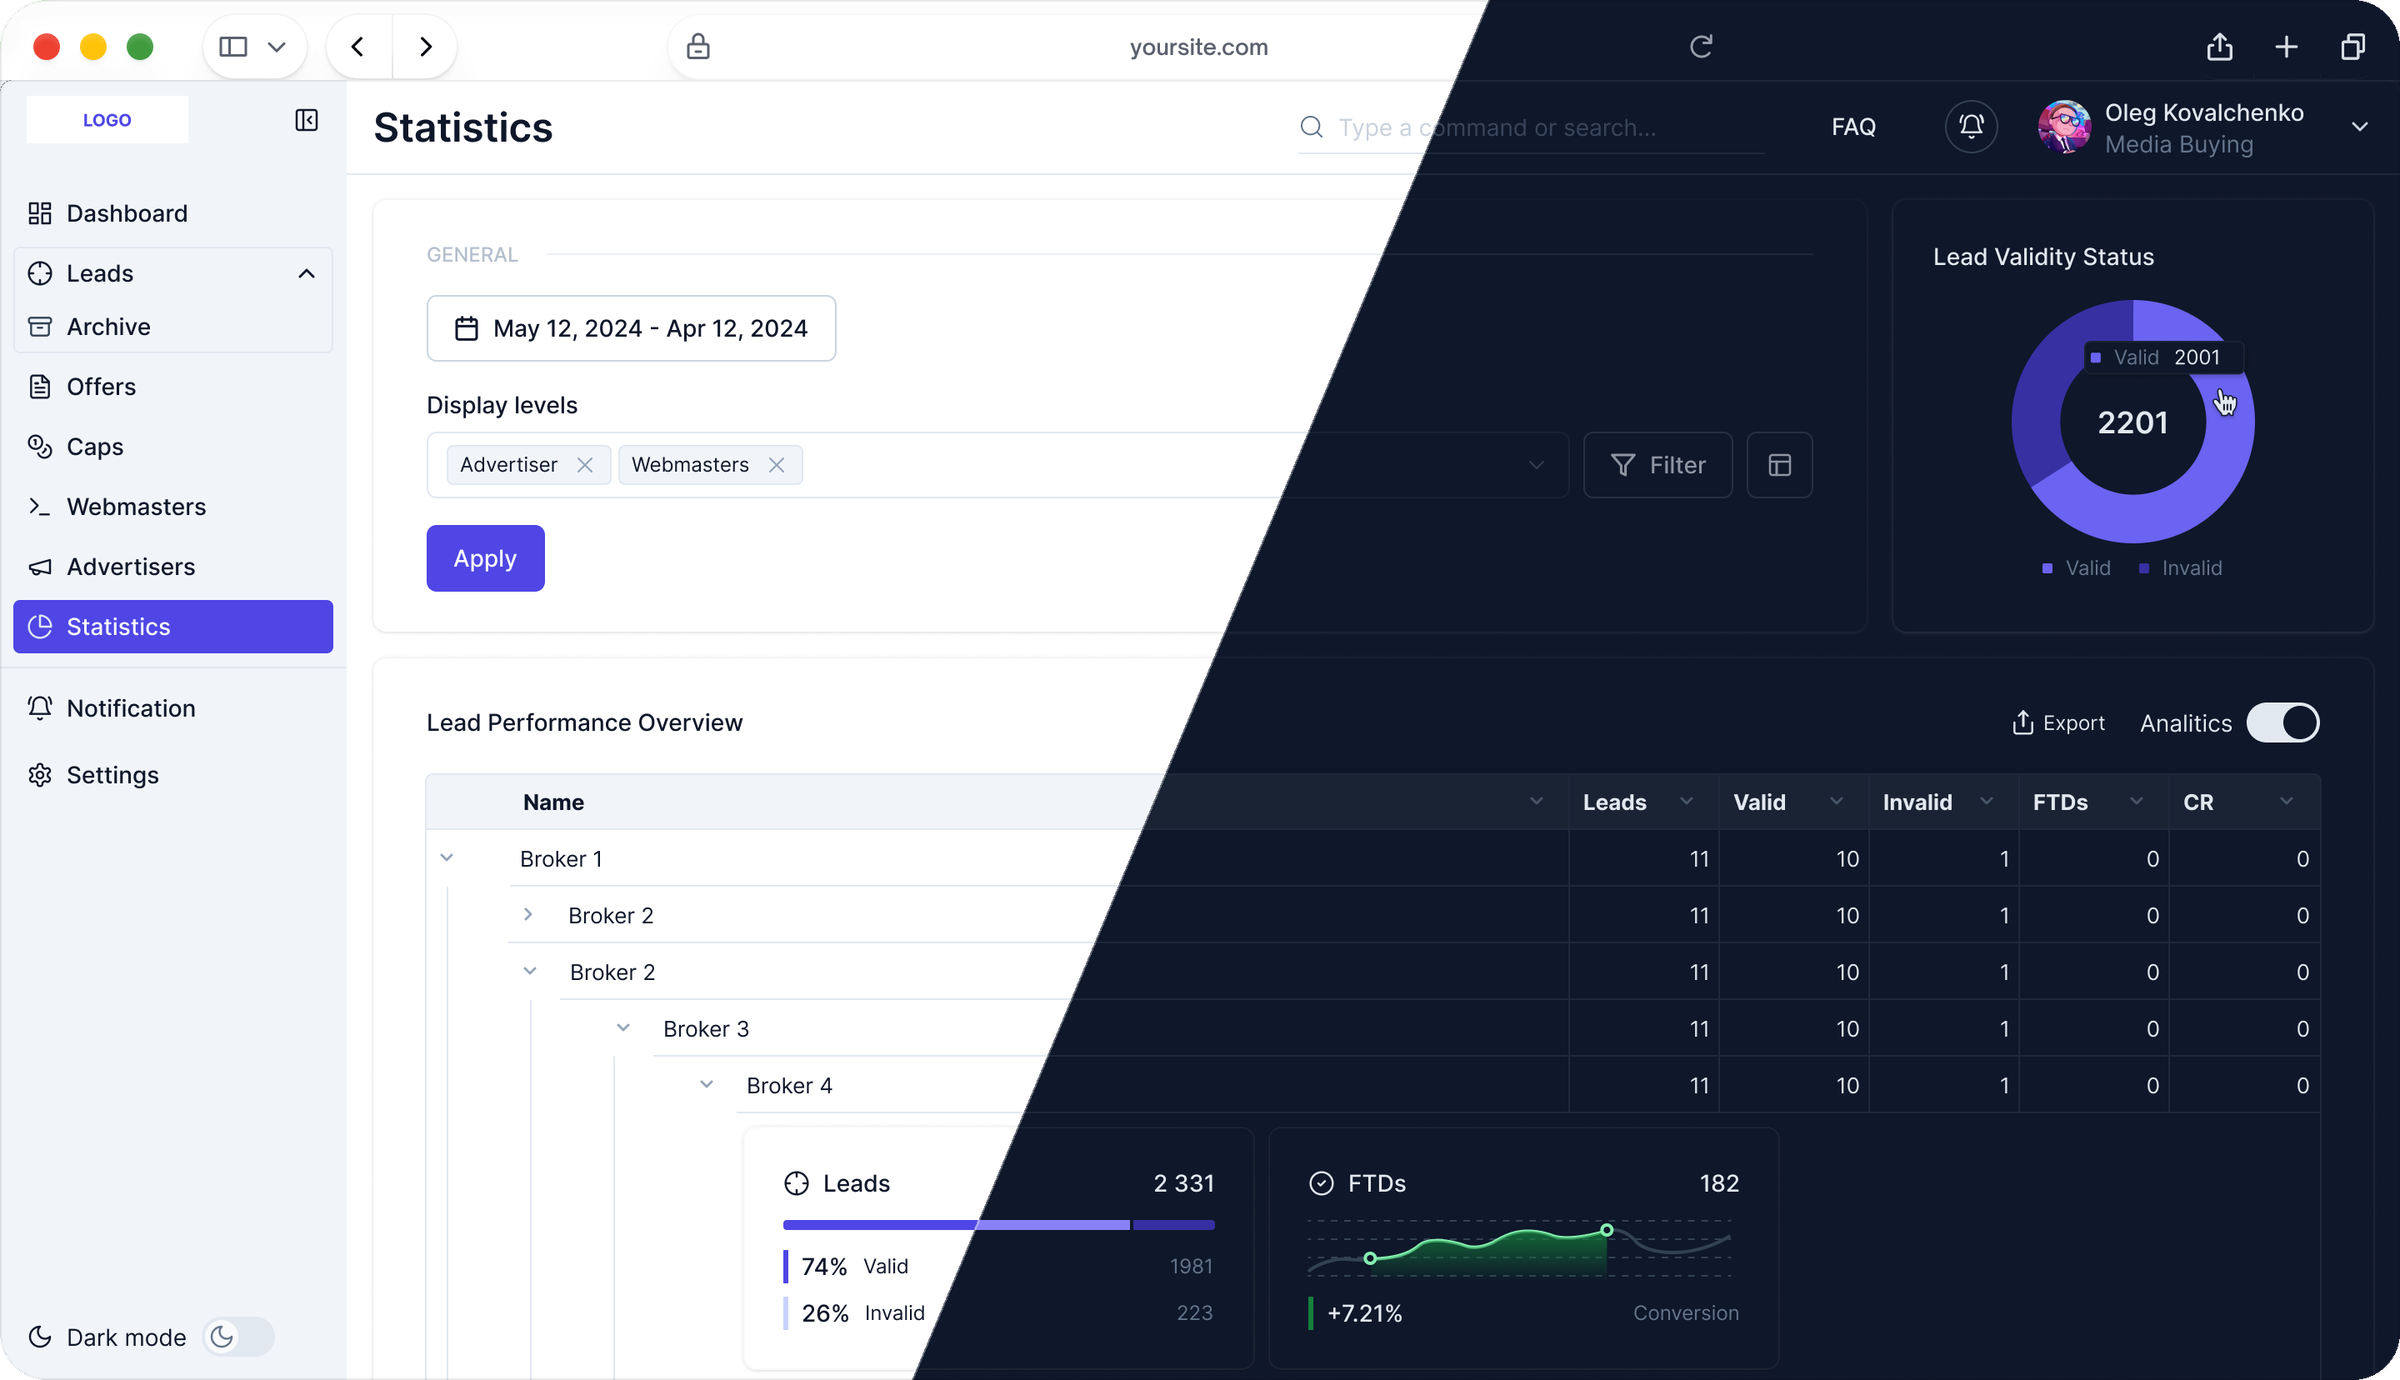
Before redesigning any flow I mapped what each user type needs. Everyone works in one shared workflow and sees only the fields and functions that matter to them; admins decide which parameters are open or restricted for each type. Light and dark themes went into the system from the first component, because people sit in this CRM for hours.
Trade-offMore access settings for admins, less noise for everyone else.
User settings with the Change permissions window: rights grouped by module, each one a checkbox
Admins open or restrict each function per user, module by module.
The Statistics screen split diagonally: light theme on the left, dark theme on the right
One screen, two themes: the same components in light and dark.

Then, module by module, in parallel with the team:

3

The leads table: from a segment to an action

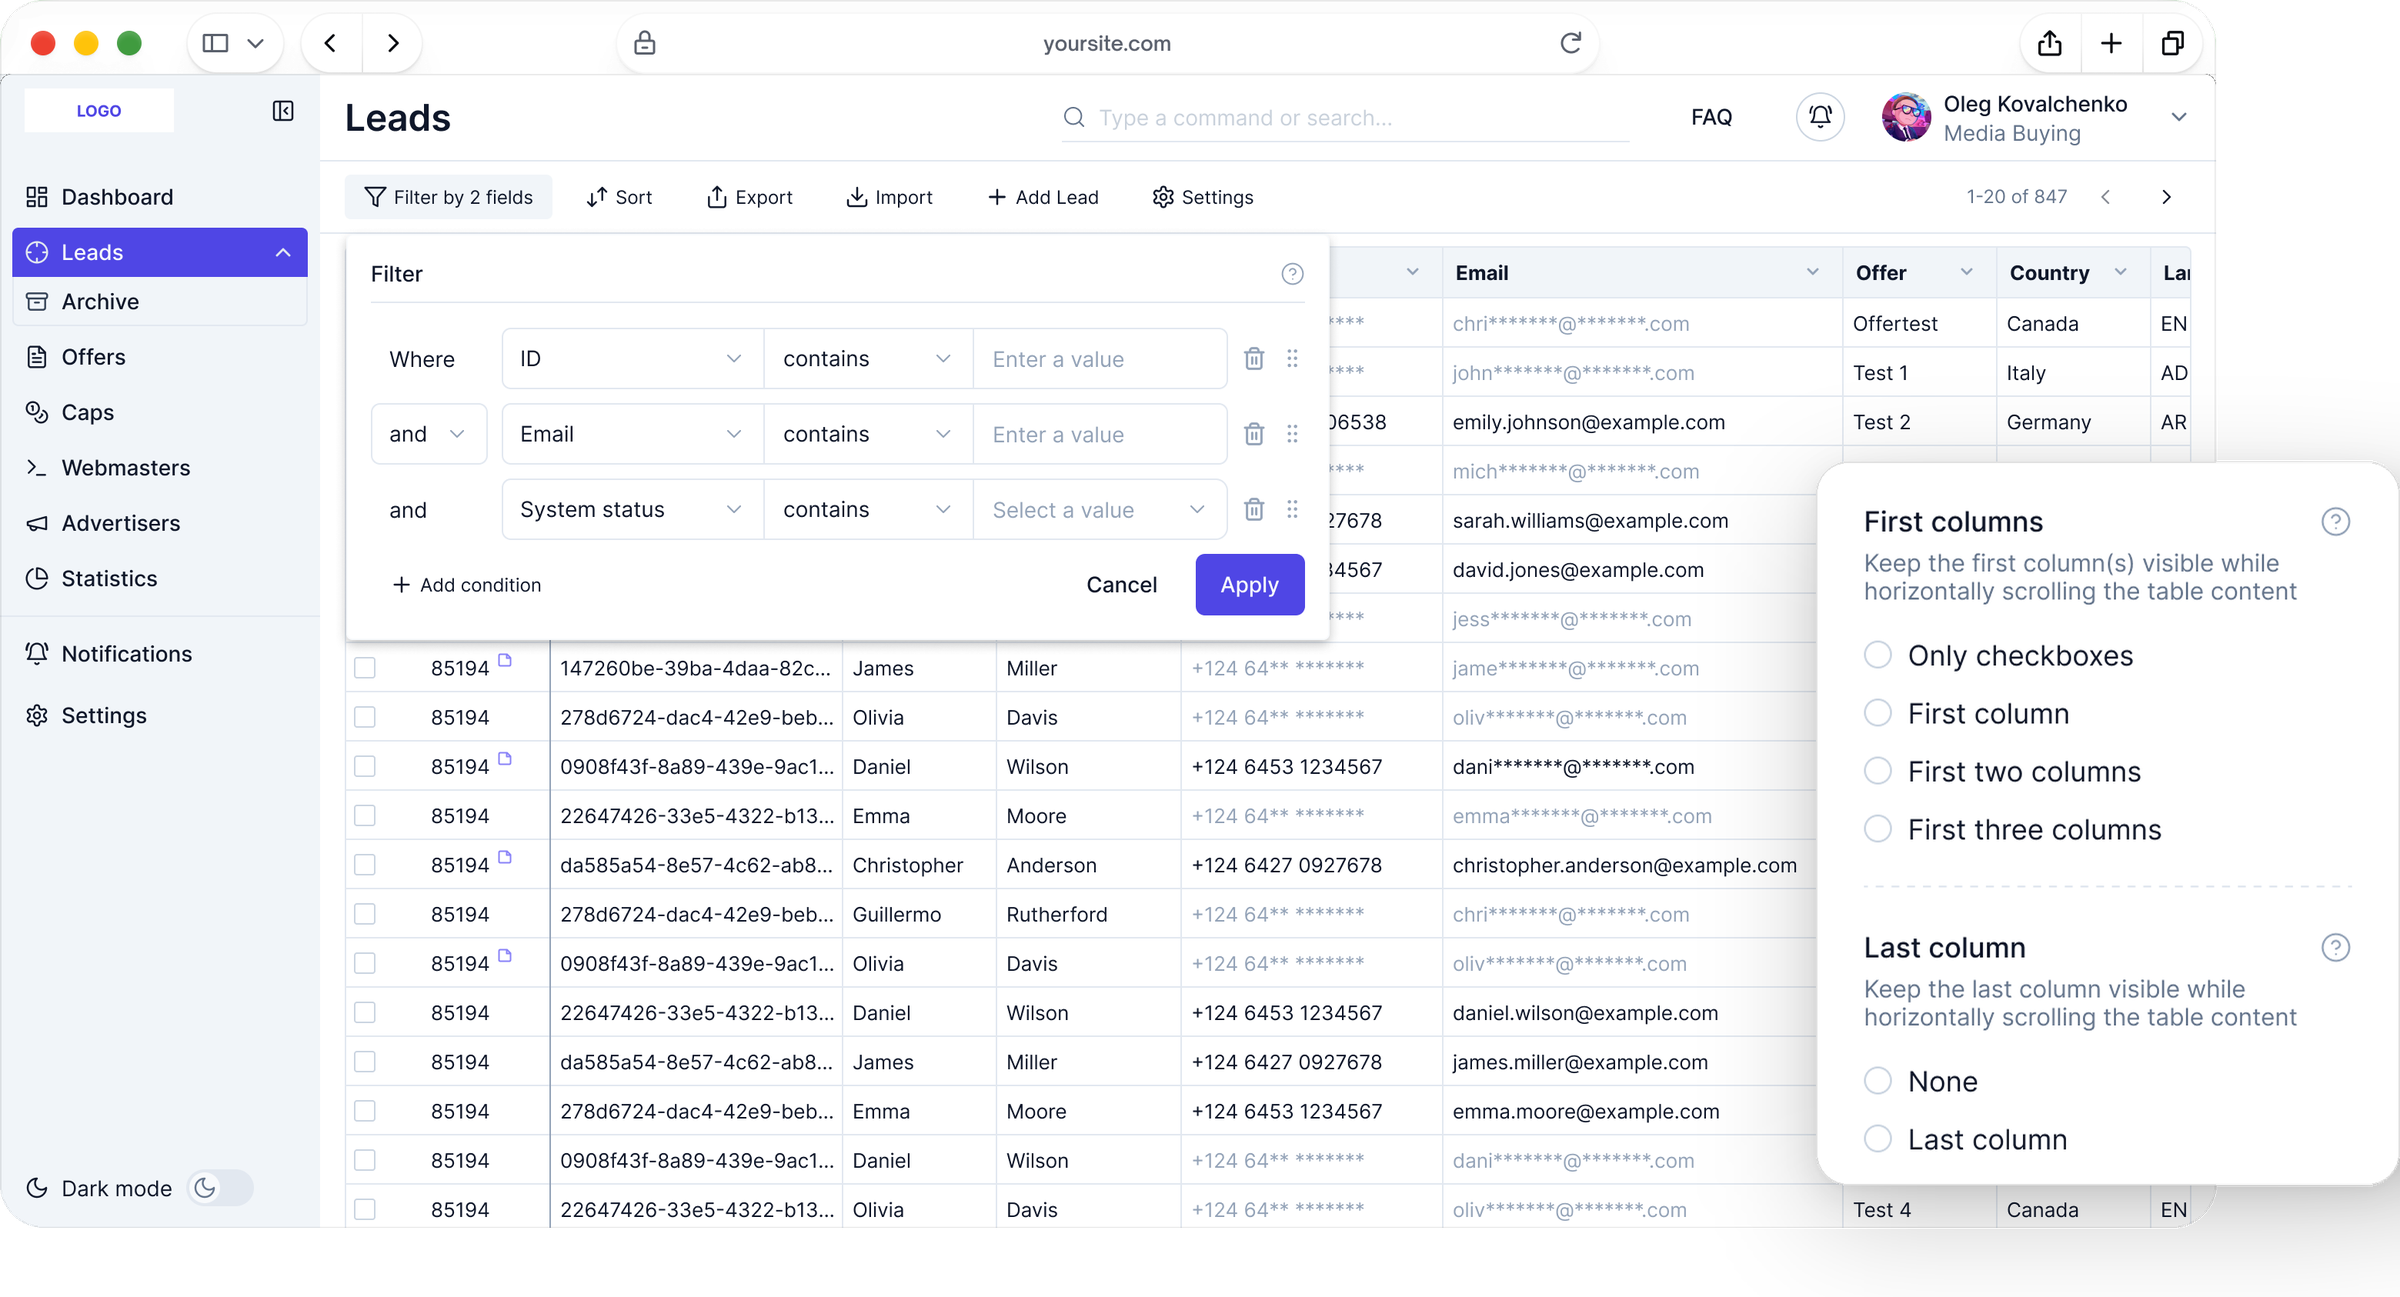
Media buyers segment leads all day, across many parameters at once. I designed a filter that combines conditions with AND / OR, pinned first and last columns, so checkboxes and actions stay in view on wide tables, and bulk actions for the selected rows — assign, change status, export.
DecisionThe table is where the work happens — so the table got the most care.
Leads table with the filter open and the options to pin the first and last columns
The filter, and the first and last columns pinned while the table scrolls.
Prototype: a segment from two conditions, pinned first and last columns, then a bulk action on the selected rows.
4

Dashboards from zero

The product had no dashboards, so this was the biggest gap. I talked to the client about which metrics matter most and which ones users need, then designed the dashboards to be customizable — cards to add and arrange, around each person’s goals.
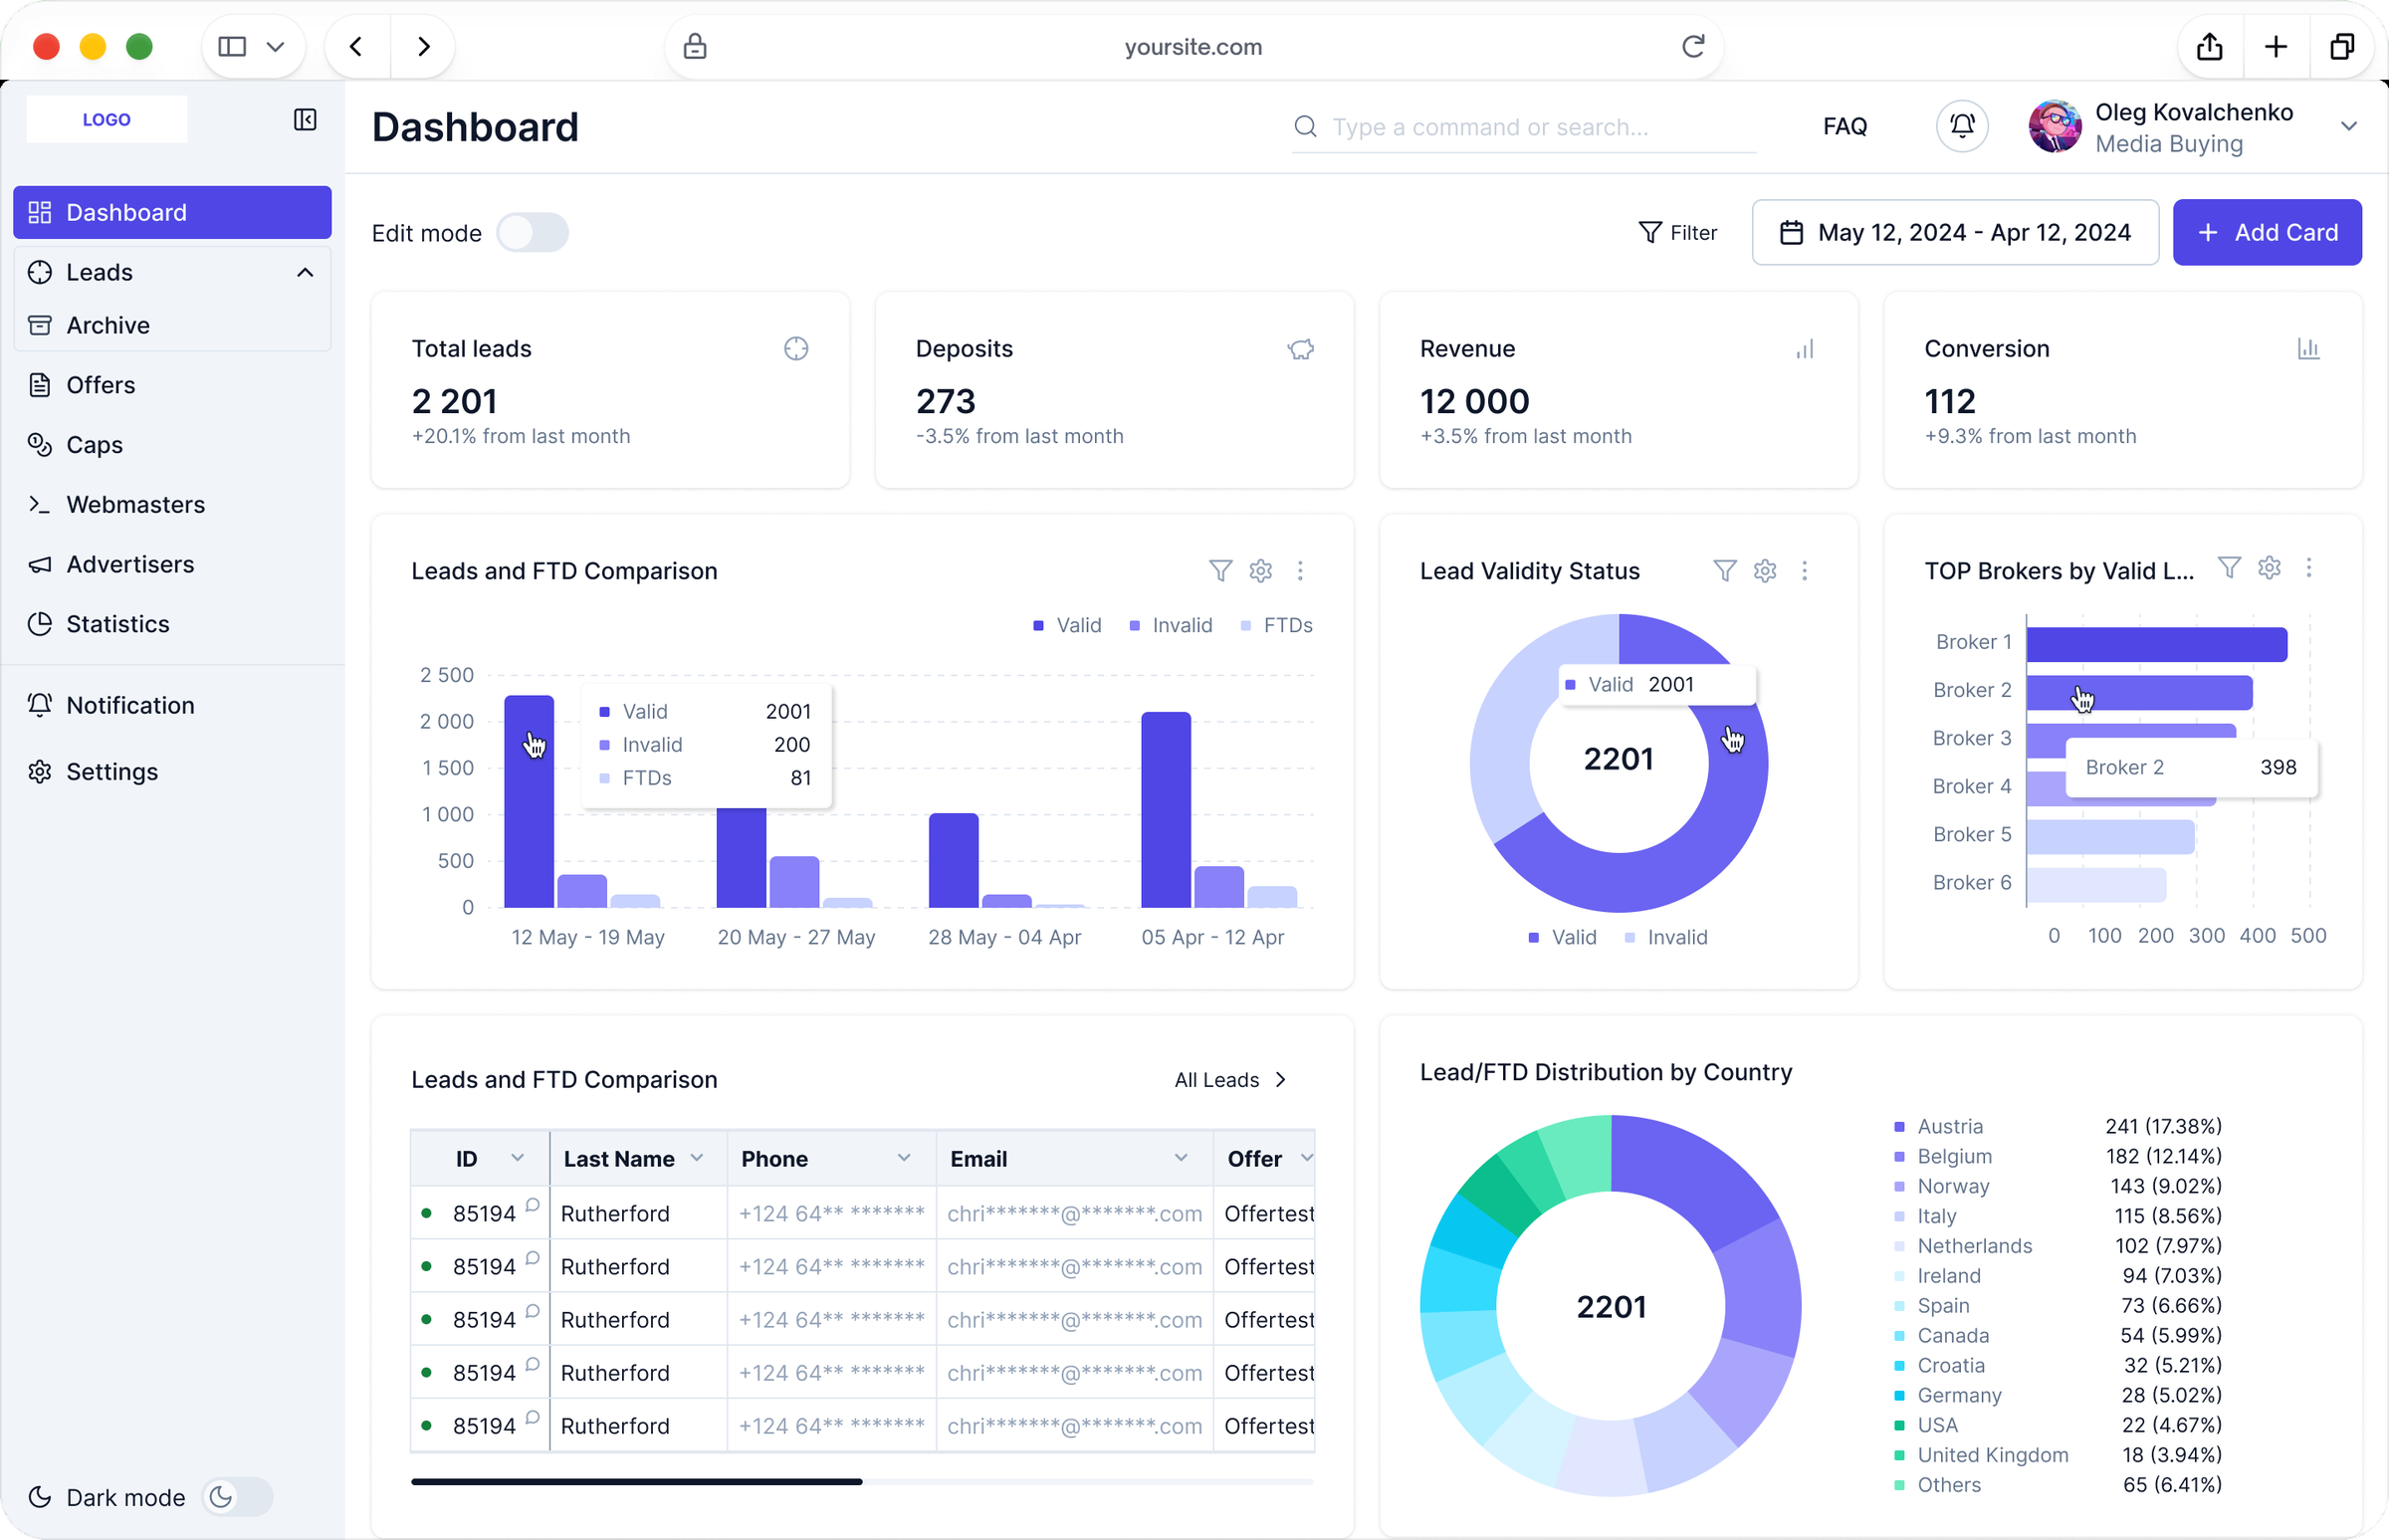
Dashboard: key numbers on top, then chart cards for leads, validity, brokers and countries
The dashboard.
5

A better version of every other flow

In each flow I looked for what slowed people down and proposed a fix, from lead context to reporting.

Added along the wayLead comments and an activity timelinePayment history and a statistics sectionNotifications and fast data exportCaps groups, a simpler settings structure and an FAQ
Results

One CRM people can rely on.

A fragmented, inefficient system became a clear, structured product: unified workflows, customizable dashboards and better usability let people work faster, decide better and shape the tool around their own way of working. There are no effect metrics yet; this is what changed for the people inside it:
What changed
UsersOne place for all work; each role sees what it needs.
AdminsAccess per user type, set without developers.
BusinessA foundation that grows instead of another system.
Learnings
01Start dashboards from the questions people ask. The metrics users actually check came first, not every number the system could show.
02Stay in touch with the people who build it. Checking ideas with developers and the PM early made every improvement shippable.
03Design both themes from day one. Charts, tables and statuses read the same in either.
Next case